
I approached my project with Fingage using the basic design process I typically follow for every project. I use four basic steps: Product Definition, Concept Exploration, Iteration & Improvement, and Execution.

Product Definition: Define the challenge and goals. Interview experts and users. Create a journey map.
Concept Exploration: Perform competitive analysis. Come up with ideas for solutions based on a variety of research methods. Create wireframes, storyboards, and mockups.
Iteration & Improvement: Design and build prototypes using Figma. Test prototypes with real users and stakeholders. Reiterate and improve prototypes based on user and stakeholder feedback.
Execution: Create and launch the live product in close collaboration with the developer.
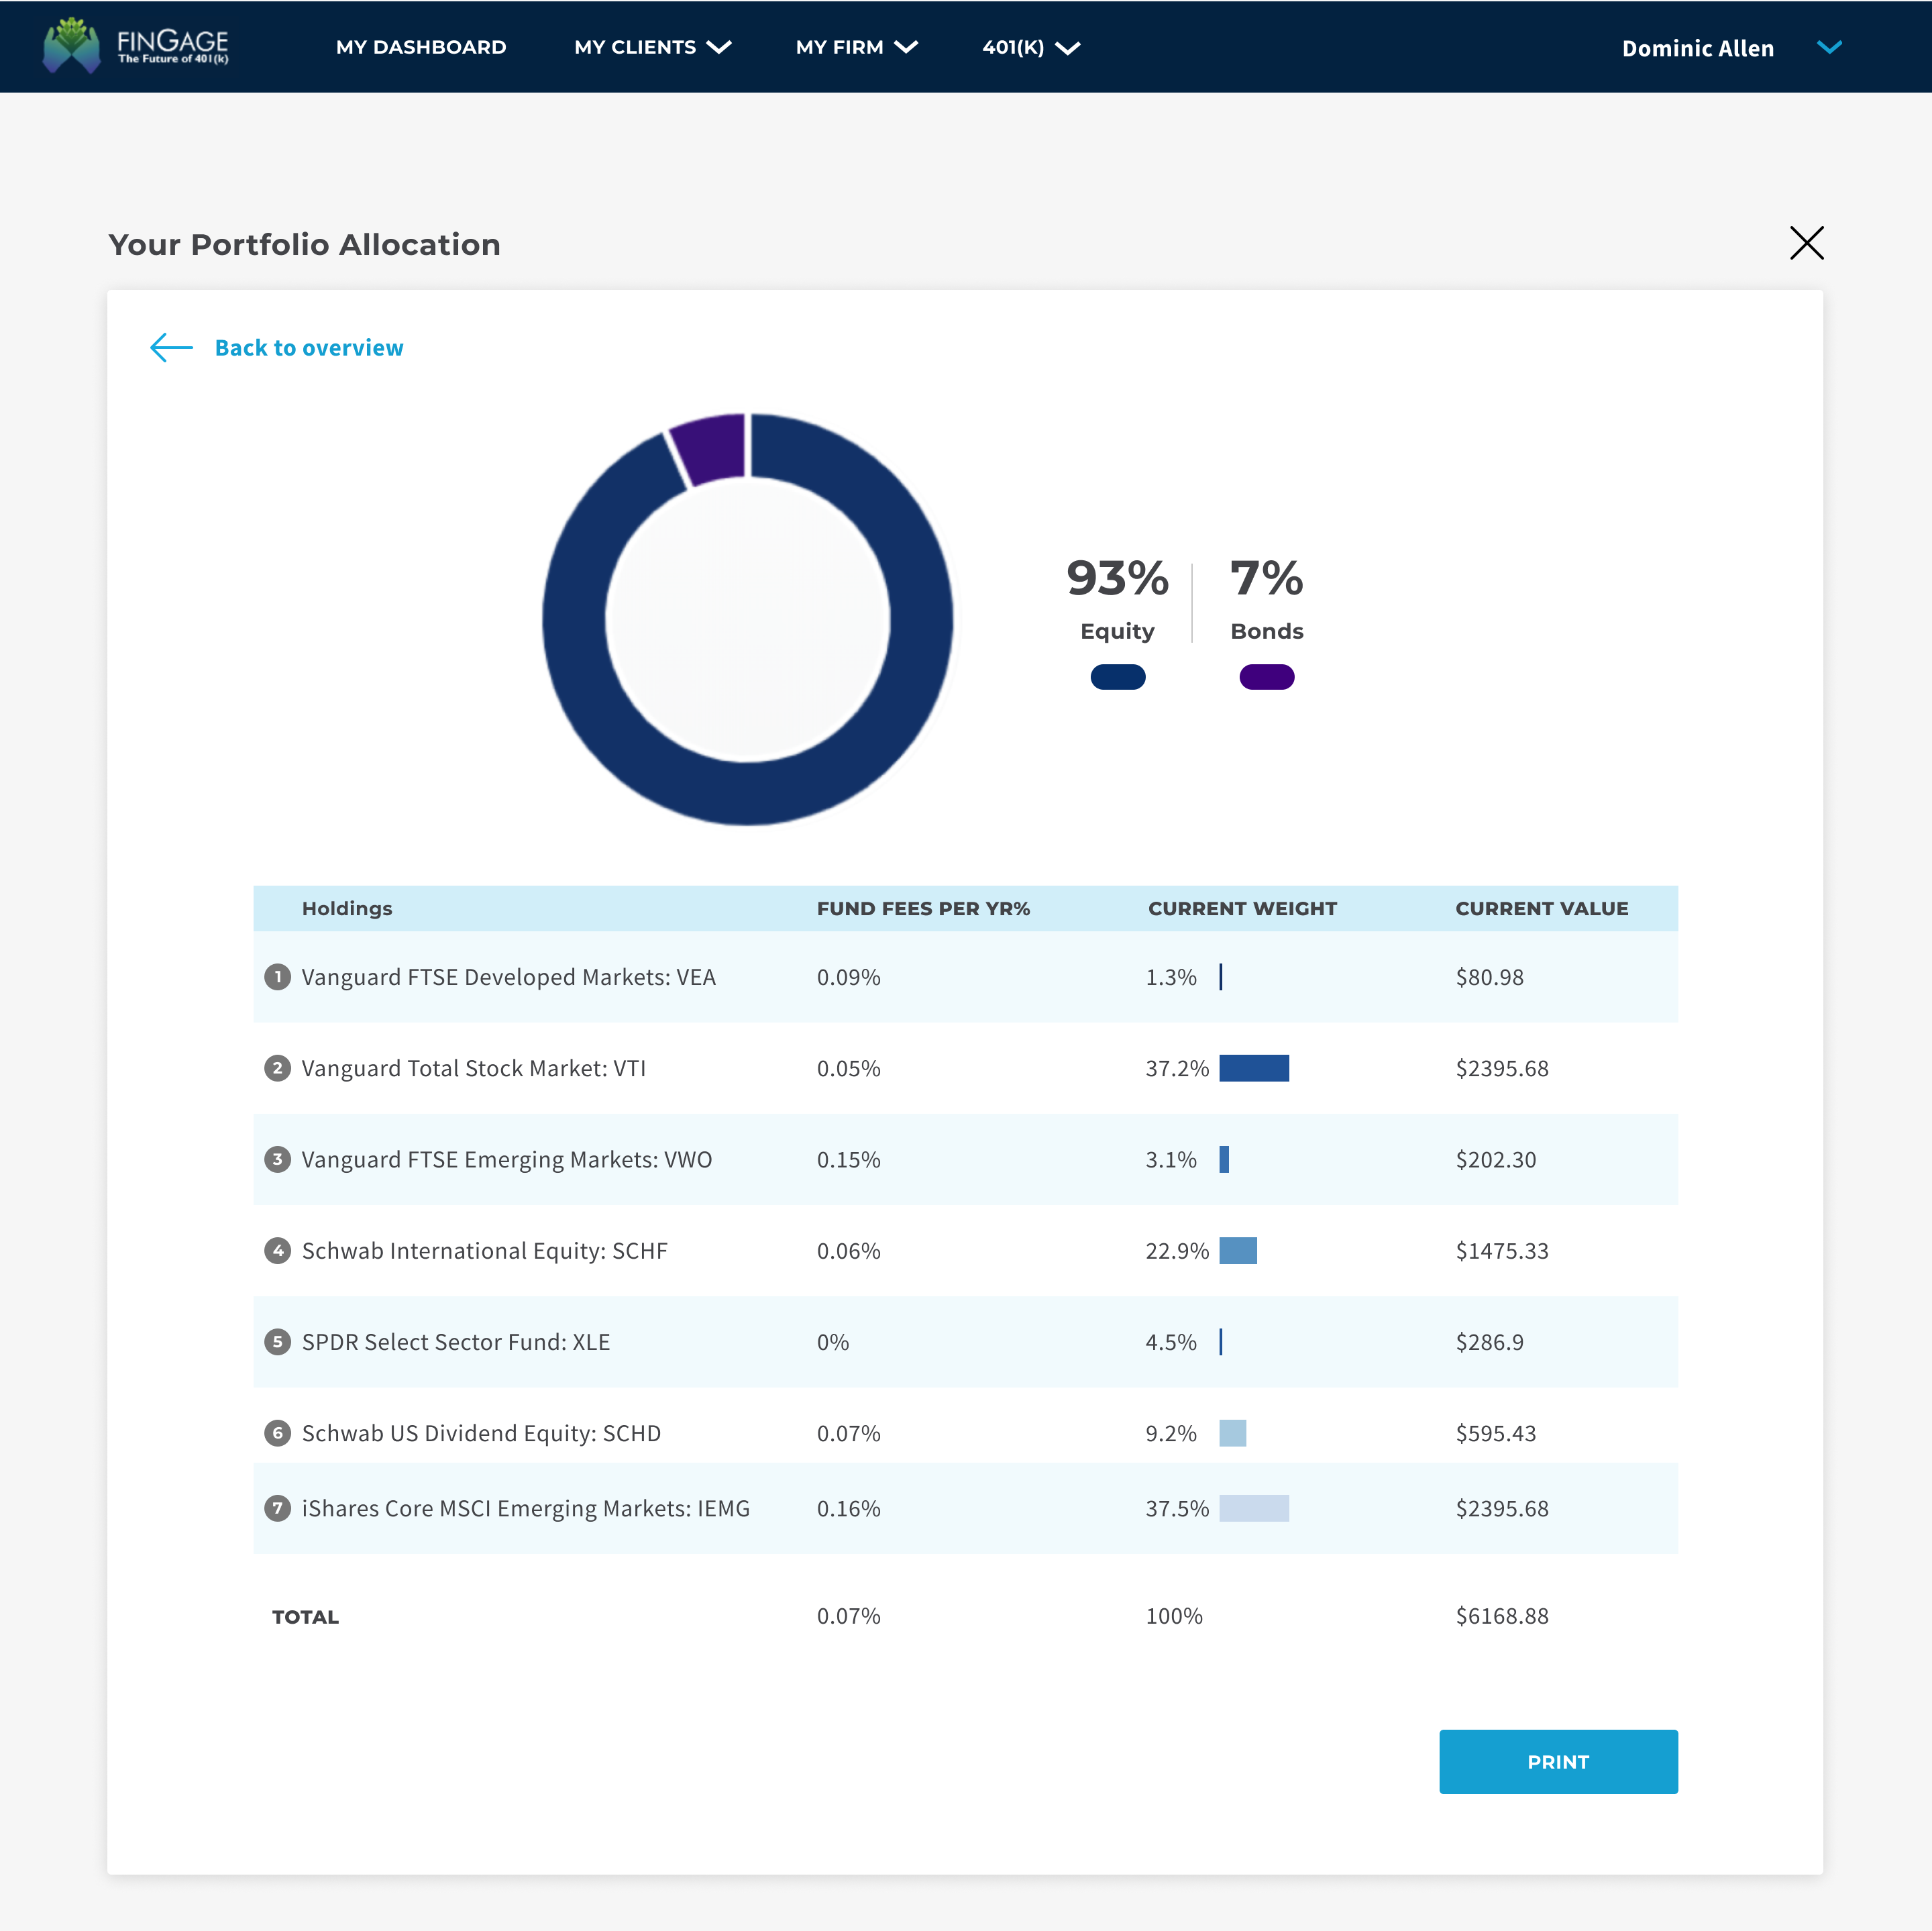
The main focus for the first project was to simplify and add a few important charts and graphs in the form of widgets to the client's account dashboard. The "Your Expected Wealth" chart, "Your Portfolio Allocation" graph, and "Glide Path Chart" needed to be added to the dashboard and also be expandable to their original full-sized versions.


For the second project, I needed to create a way for users to download a large document comparing different kinds of financial reports. According to the developer, the reports required unpredictably long download times so I had to find a way to handle that issue. I came up with two options for the C.E.O. to choose from. In the end, he went with Option 1.


The third project mainly dealt with changing icons and adding additional actions to certain items on a list page. Initially, the C.E.O. wanted to add a third icon in order to add one new option to the "Actions" section but we came to the realization that in the future we would need to add more and more actions so instead of more icons, we decided on a "more/ellipsis" icon and a drop down so we would be able to add an infinite number of actions in the future.

